

Overview
AI Usage is a single-page analytics dashboard showing usage costs, call volumes, duration, and profit for your agents across every connected AI provider. Everything — period filter, provider tabs, headline metrics, cost pies, top-agent chart, and per-agent tiles — lives on the same page; no modal hop required to read the basics.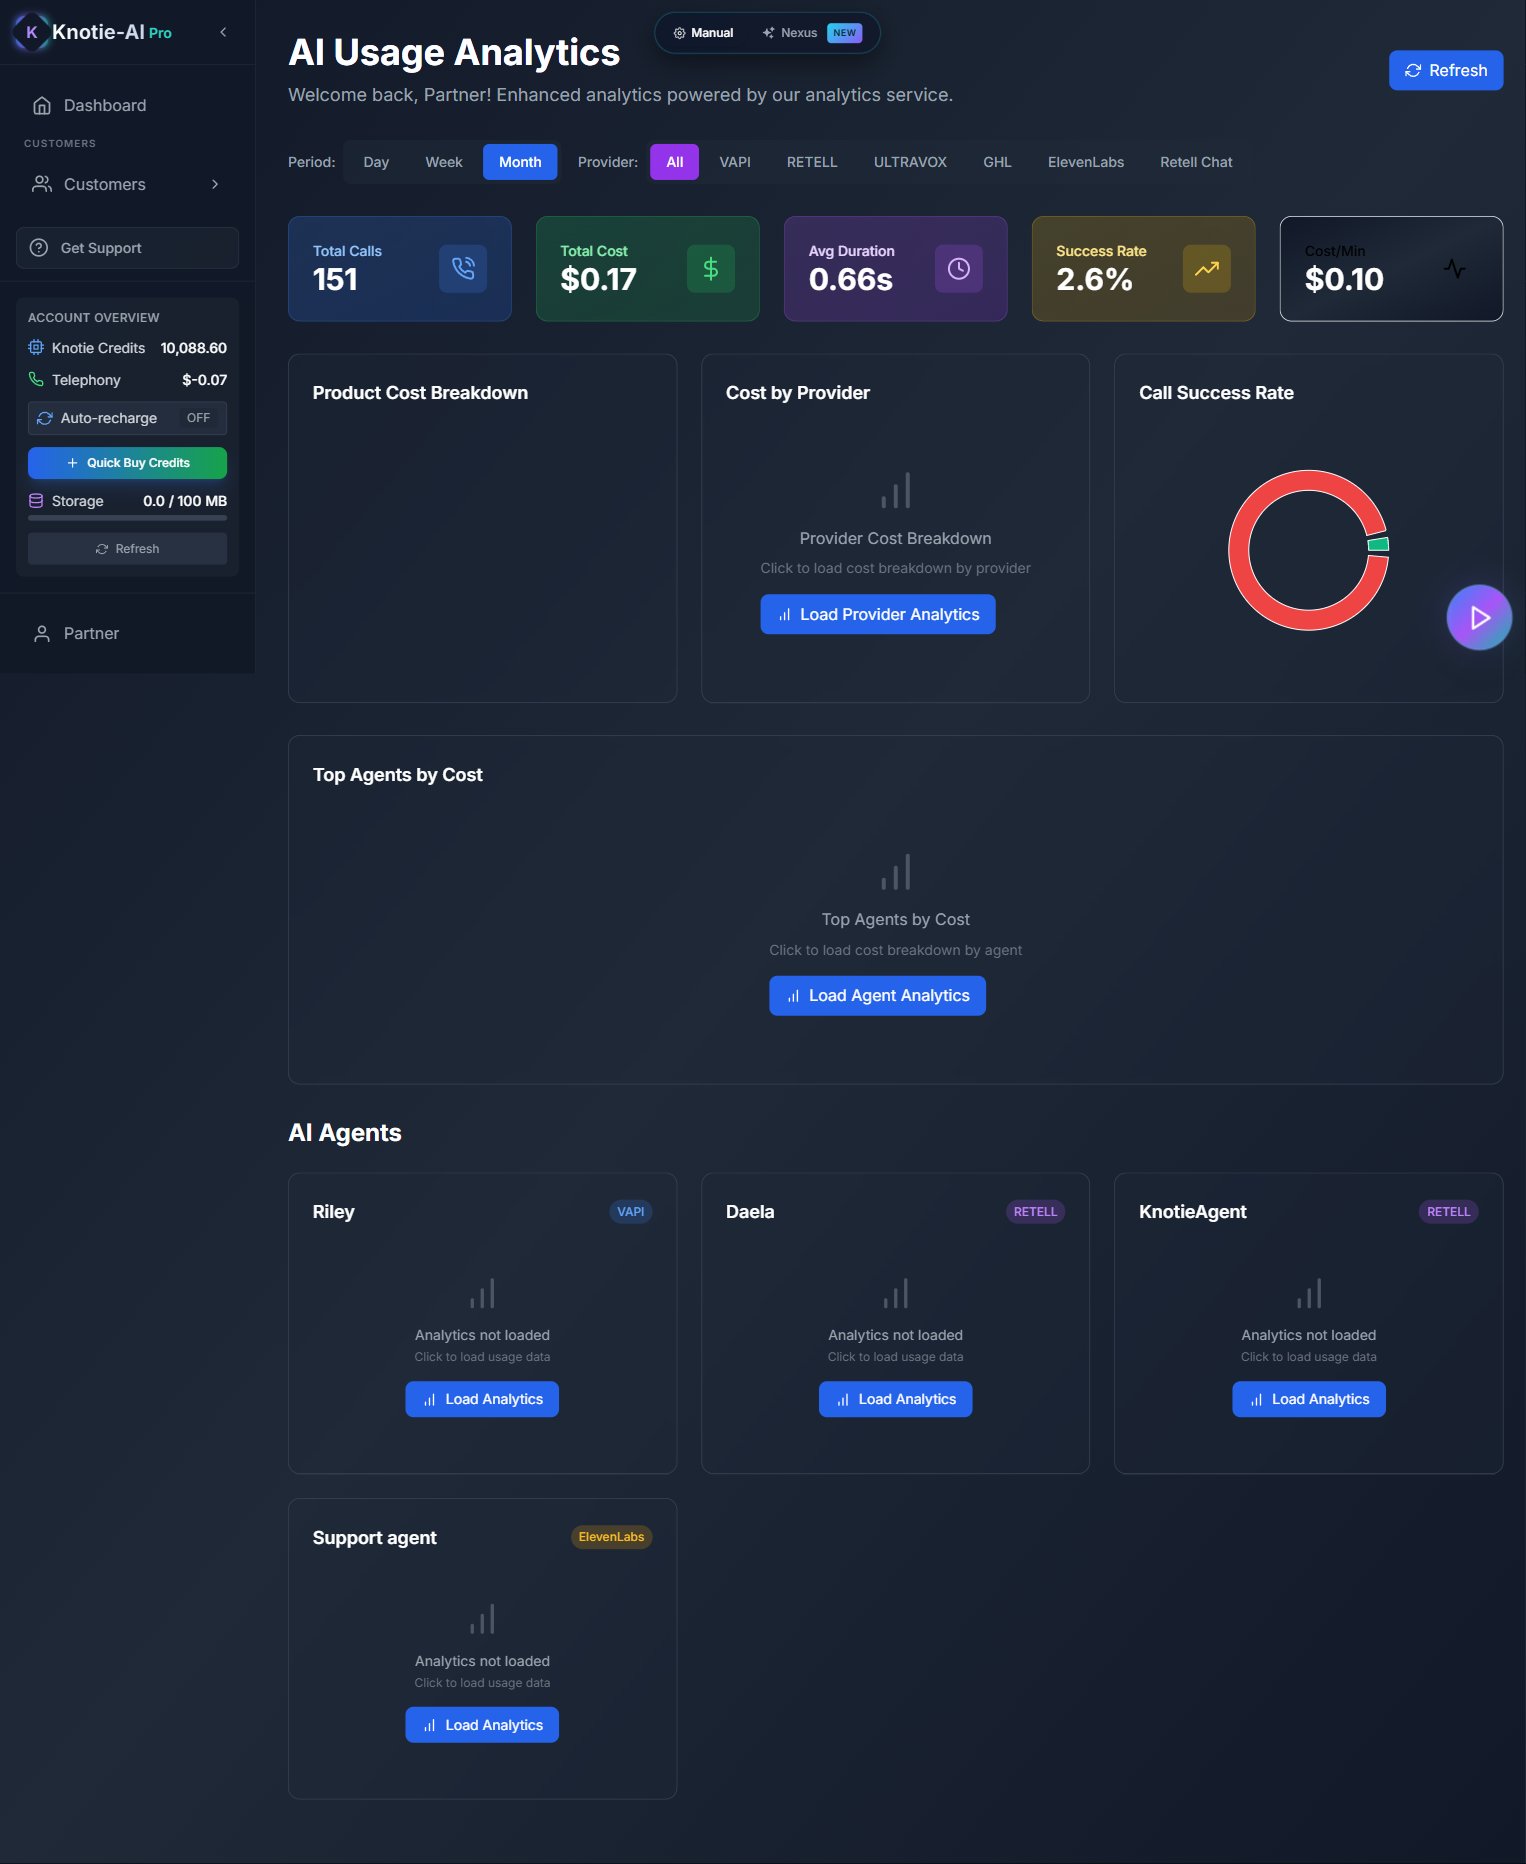
Where to find it
- Partner Portal → Agent Analytics in the sidebar. The page header reads “AI Usage Analytics” — the sidebar and header use slightly different names for the same page.
Supported providers
Voice-agent providers (matching the Provider filter row below):- VAPI Agents
- Retell Agents
- Ultravox Agents
- GHL Agents
- ElevenLabs Agents
- Retell Chat
Provider list vs filter row: Knova Agents is a live voice-agent provider, but may not appear on the AI Usage filter row. If you don’t see Knova calls on this page, check the per-agent View Detailed Analytics modal — Knova spend appears there even when missing from the filter row.
Metrics tracked
Filter by period and provider
The top of the page has two filter rows:- Period:
Day/Week/Month— recalculates every metric and chart for the selected window. - Provider:
All/VAPI/RETELL/ULTRAVOX/GHL/ElevenLabs/Retell Chat— narrows the page to one provider’s agents (orAllfor cross-provider totals).
Cost breakdown
Three pie charts sit directly below the headline metrics on the same page:- Product Cost Breakdown — share of cost across product types (LLM / STT / TTS / Provider fees)
- Cost by Provider — share of total spend by upstream provider
- Call Success Rate — successful vs failed call ratio
Agent tiles and detailed analytics
Below the pies, the page renders a Top Agents by Cost bar chart, then a grid of per-agent tiles. Each tile shows the agent’s headline numbers (Total Calls, Billable Cost, Actual Cost, Profit, Avg Duration, Success Rate, Cost/Min) and a View Detailed Analytics button that opens a deeper modal for that single agent.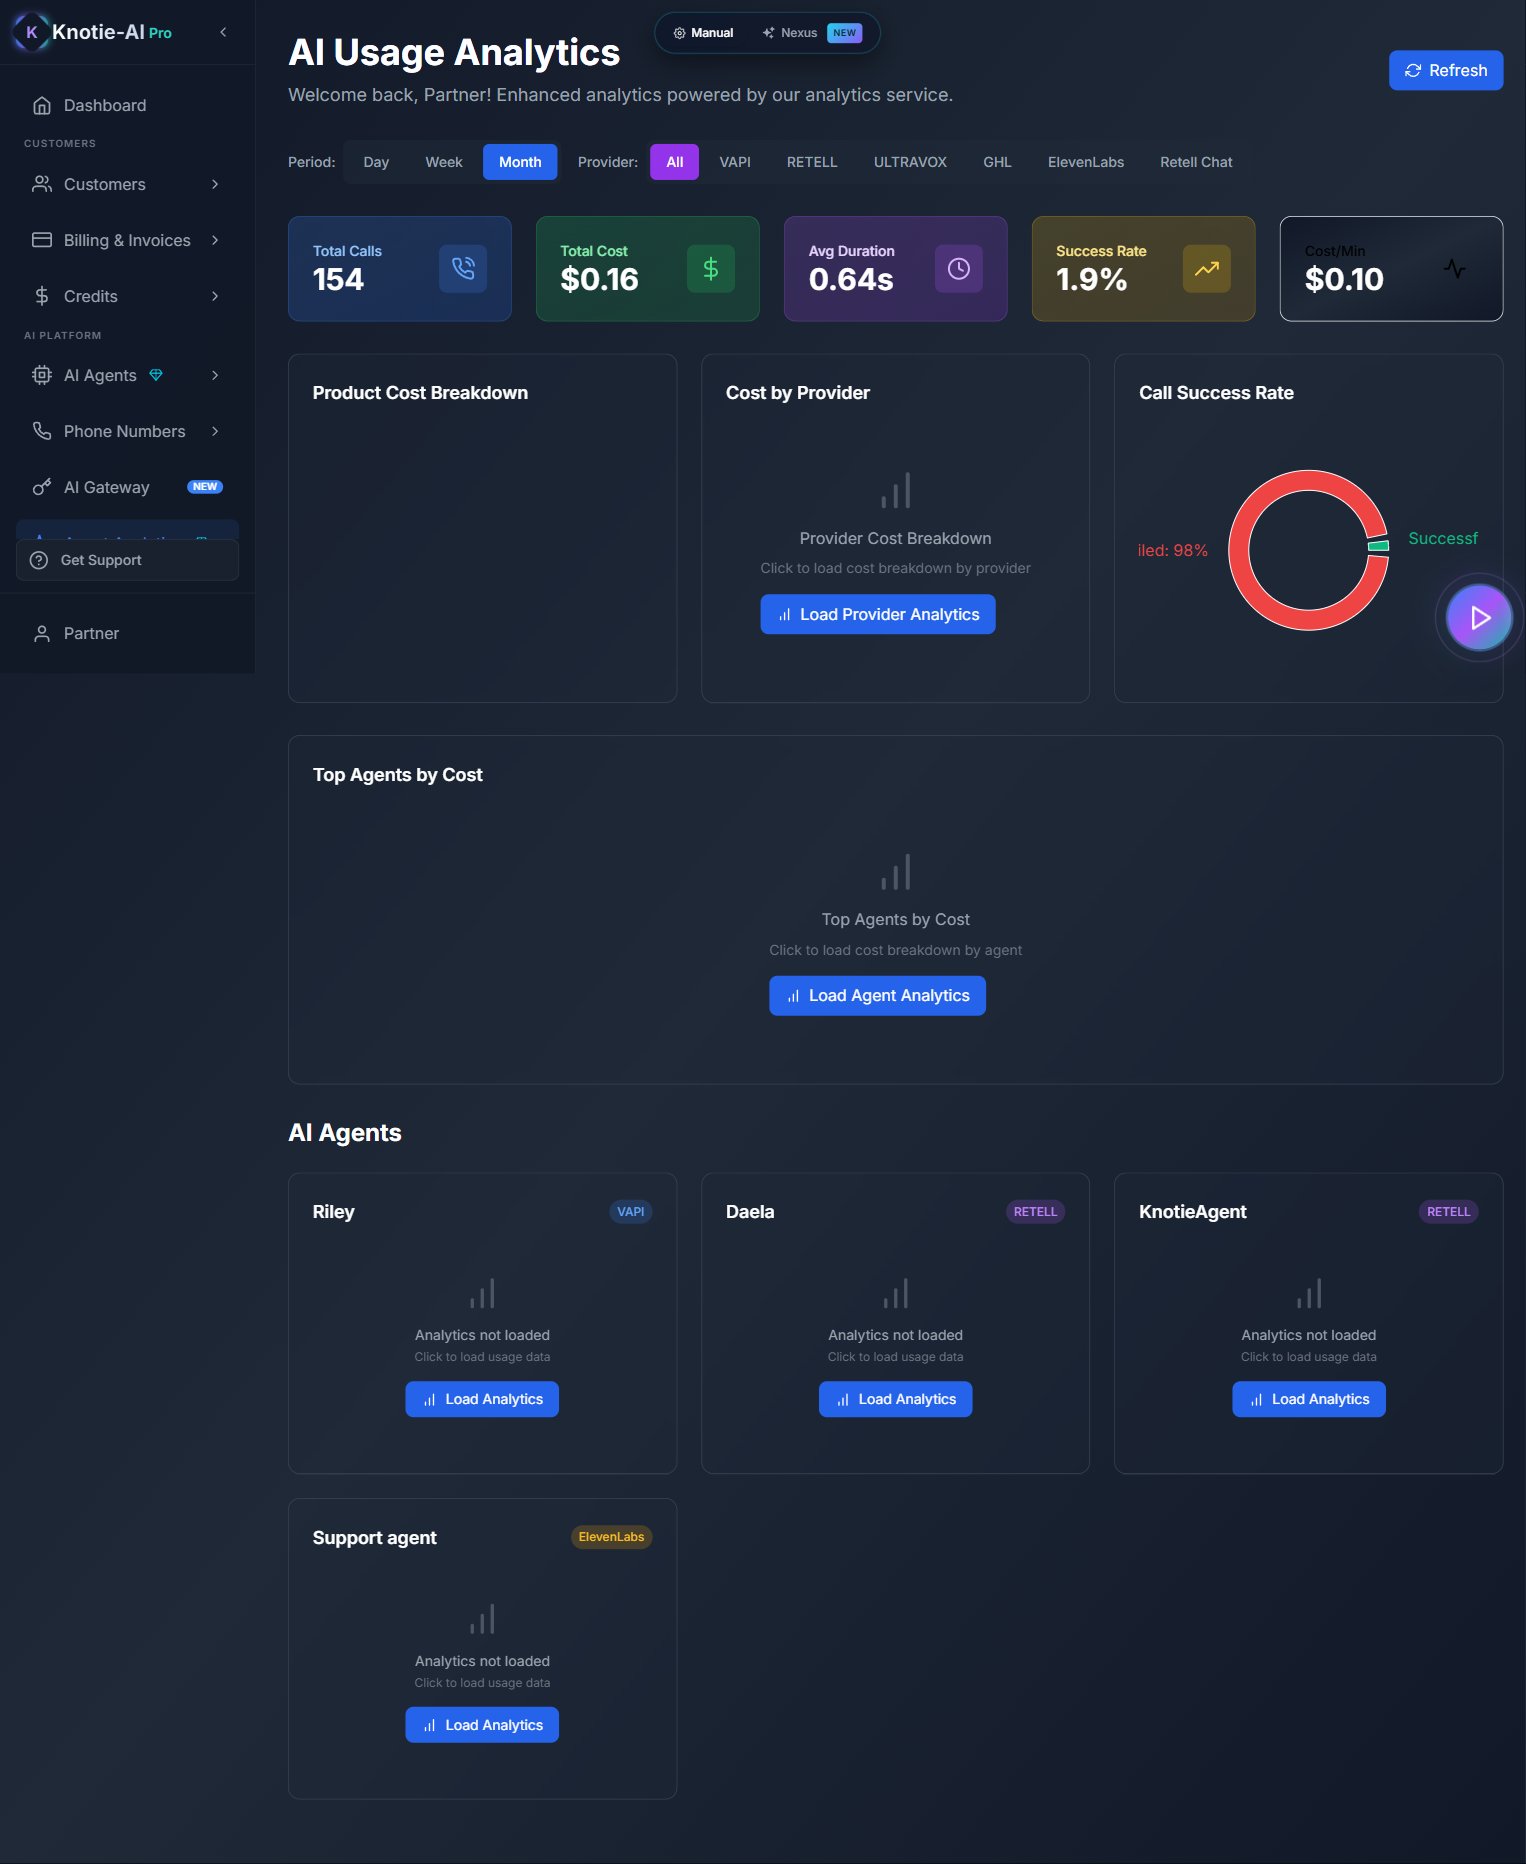
The provider badge on each tile (RETELL,ElevenLabs, etc.) reflects the upstream provider; tiles from disabled providers won’t appear under theAllfilter.
Profit analysis
The analytics modal shows a profit analysis bar chart:- Actual Cost — what you pay the provider
- Billed Cost — what you charge the customer
- Profit — difference between billed and actual
Retell summary
The Retell tab shows a summary row at the top with:- Total Cost
- Total Duration
- Total Calls
- Success Rate
Refresh data
Click Refresh Summary to reload aggregate data for the Retell tab.API key issues
If an API key is missing for a provider, you’ll see a red error banner with a button to navigate to Settings to configure the key.Next steps
- Agent Analytics — more usage insights
- AI Gateway — manage API keys and budgets
- Credits — add credits when low